7 Metrics Overview
The toolkit turns retained, pseudonymous WiFi observations into five progressively richer metrics: Location, Count, Track, Revisits, and Activities. This framework extends the human-sensing taxonomy in Figure 2 of1 (presence, count, location, track, and identity). Presence is subsumed by Count, identity is renamed Revisits to describe observed visit frequency rather than personal identification, and Activities adds inferred stationary behavior. The graphic below illustrates the progression.
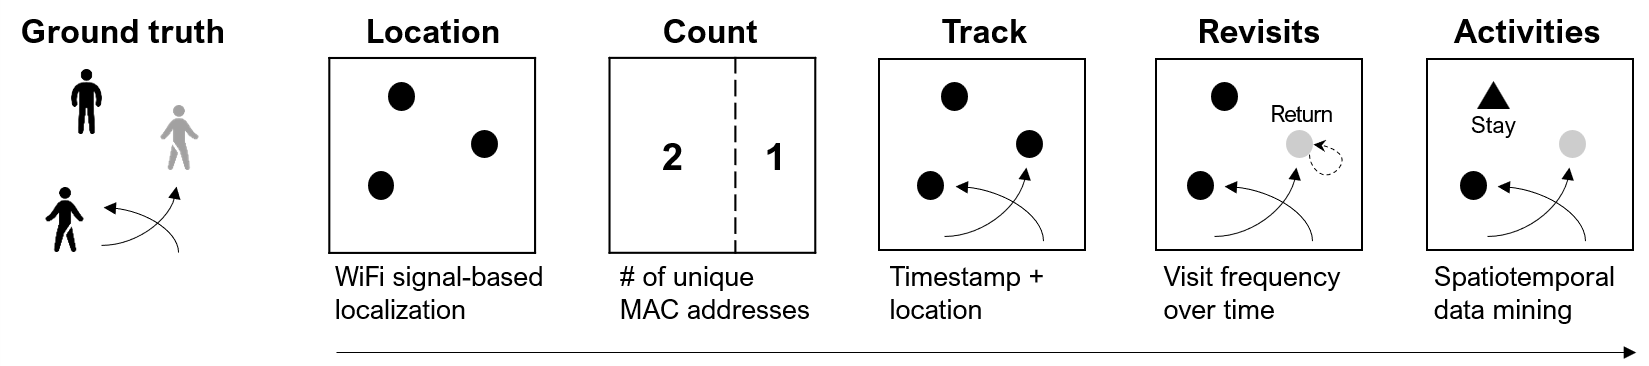
Location: Where Are People at a Specific Time?
Location assigns each retained identifier-time window either to a sensor position or to an estimated coordinate between sensors, using the pattern and strength of detections received by the sensor array.
Before counting, we must pinpoint location. Without knowing where devices are, we just have a total count.
Imagine a room with three people, just like in the diagram above:
- Without location data, counting retained pseudonymous identifiers only tells you there are three observed device signals in total.
- With even rough location data, you can determine that two devices are on the left and one on the right, providing much richer information.
Count: How Many Over Time?
Count tallies distinct retained pseudonymous identifiers over specified windows. It measures observed device presence and relative activity patterns; it is not an uncalibrated count of people.
Track: Where and When Did They Move?
Track links successive locations of the same retained identifier within a bounded trajectory. Aggregated origin–destination pairs reveal recurring sensor-to-sensor flows, not surveyed trips or exact pedestrian paths.
Revisits: How Often Was an Identifier Observed?
Revisits summarizes observed frequency over a declared observation window. The commercial-district demonstration counts days on which a retained identifier produced at least one quality-filtered trajectory, then distinguishes Single-day observed from Multi-day observed. These labels do not identify a person or reveal how often that person actually visited.
Activities: Where Are Stays Inferred?
Activities groups nearby observations into continuous episodes and classifies sufficiently long, spatially stable episodes as inferred stays. The metric distinguishes inferred stays from pass-throughs; it does not determine the activity or intent of a person.
Modern mobile devices randomize source addresses for privacy protection. The maintained pipeline conservatively removes observations whose source address has the locally administered bit set (Chapter 6), so flagged records do not fragment a trajectory; they are absent from the retained sample.
- Location and Count require the least persistence, but both describe the retained sample rather than all devices or people.
- Track and Activities require one retained address to persist within a trajectory or episode.
- Revisits requires the retained address to recur across qualifying observation days and is therefore the most constrained.
The usable retained share is deployment-specific. Validate the retained and removed address streams at every site and calibrate absolute pedestrian estimates against independent counts; see Appendix B.
To assess accuracy, we compare WiFi-derived metrics against ground truth data such as manual counts or GPS logs. The Location chapter validates position estimates against GPS ground truth; the other metrics build on those localized detections.